Background:
A hard parse occurs when a SQL statement has to be loaded into the shared pool. In this case, the Oracle Server has to allocate memory in the shared pool and parse the statement.
A hard parse is a heavy process in terms of resources (CPU & Memory), and we should avoid whenever possible.
Excessive hard parsing can occur when the shared pool is too small, or when you have non-reusable SQL statements without bind variables.
In this post, where we have a database application with excessive parsing issue, we will see if there is a way to locate the top statements that are producing lot of hard parsing?
One may think of the AWR report, where there is a section titled “SQL ordered by Parse Calls”, but this is not only hard parse calls, it contains also soft parse. So, if you are interested in top hard parse statements, please keep reading.

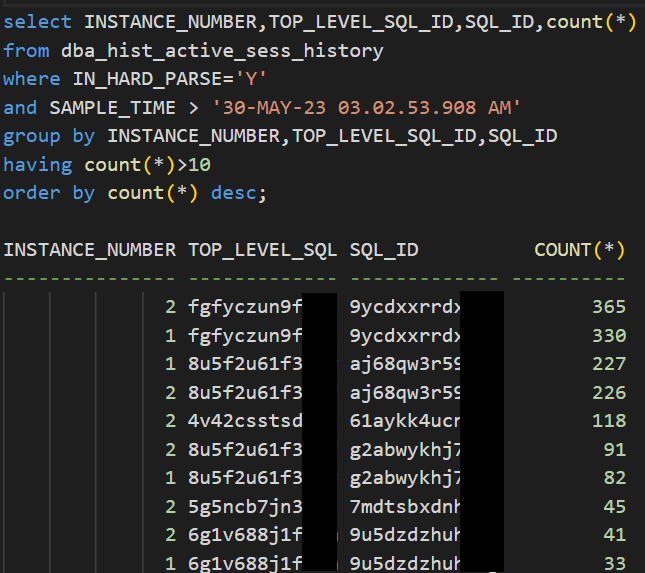
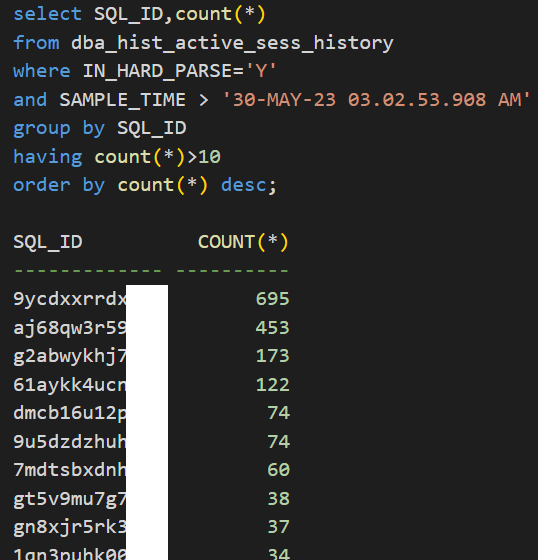
Following is SQL statement that I can use to query dba_hist_active_sess_history table for statements with IN_HARD_PARSE=’Y’. I will write the same query with different options to best fit many cases and requirements:
select INSTANCE_NUMBER,TOP_LEVEL_SQL_ID,SQL_ID,count(*)
from dba_hist_active_sess_history
where IN_HARD_PARSE=’Y’
group by INSTANCE_NUMBER,TOP_LEVEL_SQL_ID,SQL_ID having count(*)>10
order by count(*) desc;
Here below are some variations from the above query executed against live database with hard parsing issue:

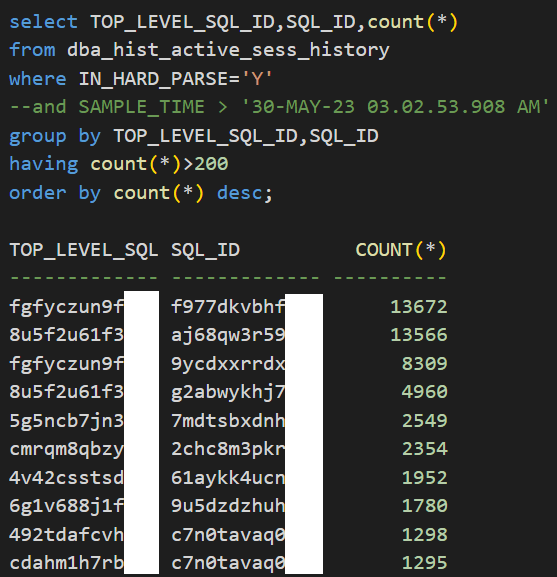

After you got the SQL_IDs of top hard parsing statements, you may use the following query to get the full text of the statement given its sql_id:
set long 4000
select sql_fulltext from v$sql where sql_id=’f977dkvbhxxxx’;
